
 Estimated Reading Time: 8 Minutes.
With economies’ expansion, airports became one of the busiest indoor environments on the globe. Thousands of travelers pass through these spaces every hour, so they face unique air quality challenges that typical commercial buildings do not. Managing indoor air quality has become the most important value in ensuring passenger comfort, staff safety, and compliance with global building standards.
In this article, let’s break down the science behind this mystery. How do modern transportation hubs monitor, control, and improve air quality through continuous monitoring and advanced sensor technology?
Why is IAQ a Serious Issue in Airports?
According to the International Civil Aviation Organization, it is no doubt that airports are always surrounded by outdoor pollution infiltration, like jet exhaust, ground vehicle emissions, and PM2.5 and NO₂ from runways. Unlike offices or schools, indoors in airports tend to face more unpredictable environmental pressures, such as high passenger density with crowding in waiting areas and security lines leading to elevated CO₂ levels, increased bioaerosols, and greater humidity fluctuations.
Consequently, these pollutants easily enter indoor terminals through doors, ventilation systems, or airside operations. Hence, most countries regulate local air quality from time to time, and a comprehensive and effective package for measuring ambient pollution and mitigating emissions is necessary to address environmental challenges in the coming years.
The regulatory frameworks used can vary based on the specific context, such as the U.S. Environmental Protection Agency (EPA) published The Clean Air Act, which was last amended in 1990, to set National Ambient Air Quality Standards for six principal pollutants in order to define the safe levels of air pollution to protect both public health and the environment.
Gathering the resources from the EPA, the table below includes recent updates to Particulate Matter (PM2.5) and Sulfur Dioxide (SO₂). The primary annual standard for PM2.5 was lowered from 12.0 µg/m³ to 9.0 µg/m³ in early 2024, while the old 3-hour secondary standard (0.5 ppm) was replaced with a more stringent 10 ppb annual standard to protect ecosystems from acid rain and long-term exposure
|
Pollutant |
Averaging Period |
Primary Standards |
Secondary Standards |
|
Carbon Monoxide (CO) |
8 hours |
9 ppm |
None |
|
1 hour |
35 ppm |
None |
|
|
Lead (Pb) |
Rolling 3-month average |
0.15 µg/m³ |
Same as Primary |
|
Particulate Matter (PM2.5) |
Annual |
9.0 µg/m³ |
15.0 µg/m³ |
|
24 hours |
35 µg/m³ |
Same as Primary |
|
|
Particulate Matter (PM10) |
24 hours |
150 µg/m³ |
Same as Primary |
|
Ozone (O₃) |
8 hours |
0.070 ppm |
Same as Primary |
|
Nitrogen Dioxide (NO₂) |
Annual |
53 ppb |
Same as Primary |
|
1 hour |
100 ppb |
None |
|
|
Sulfur Dioxide (SO₂) |
1 hour |
75 ppb |
0.5 ppm (3-hour) |
Sources: https://www.epa.gov/criteria-air-pollutants/naaqs-table

What Causes Air Pollution in Airport?
ICAO’s Air Quality Management Report states several reasons:
- Aircraft emissions
Aircraft are the largest source of emissions at an airport. Although they are not owned or operated by the airport itself, they still happen to be the facility’s largest environmental footprint. During the LTO (Landing and Take-Off) cycle, the engines release a mixture of CO, PM (Particulate Matter), SOx, and CO₂, while the large doors located at jet bridges and baggage claims act as pumps that draw airside exhaust straight into the building. Depending on initial data, it is proven that the jet plumes from aircraft engines range from 20 to 1000 m and sometimes even more. - Ground Support Equipment
Vehicles and instruments that are associated with the activities for towing, maintenance, loading, and unloading of passengers and cargo that provide electric power, fuel, and other services to the aircraft are an important source to consider when looking at airport-related emissions. Since they often utilize diesel or high-output combustion engines, they are primary contributors to the NOx and PM2.5 infiltration that sensors often pick up during peak turnaround windows. - Infrastructure Activities
A large concentration of CO₂ and complex VOCs accumulated from human occupancy, fragrances, electronics, and materials in retail stores, gates, lounges, check-in halls, and baggage claim areas. Due to the complications of airlines, destinations, and needs, the HVAC systems in airports are forced into a blind schedule, which directly indicates more energy consumption, filtration needs, and maintenance frequency.

Suggested Practices for Airport Buildings Operations and Maintenance
The Airport Cooperative Research Program (ACRP) stimulates a document for use by airport operators, local agencies, and other interested industry associations.
- Preventive Maintenance serves as the baseline; as a rule of thumb for facilities, 25–35% of maintenance activities in a maintenance program should use a preventive maintenance approach, which is performed at regular intervals to ensure equipment is operated properly. According to ACRP, the approach of utilizing calendar- or runtime-based intervals to carry out essential tasks such as regular AHU filter replacements is estimated to yield 12-18% cost savings over reactive maintenance. Crucially, technicians can identify abnormalities, such as a loose belt or standing condensate water, which could deteriorate equipment and compromise indoor air quality.
- Predictive Maintenance represents the next evolution in facility care; 45–55% of maintenance activities in a maintenance program are required preventive maintenance approaches. Based on actual system performance, measured by permanent air monitoring sensors, it helps indicate an impending decline in efficiency or failure; with the condition of air and the functioning maintenance systems, operators can virtually eliminate unplanned downtime and achieve an additional 8–12% in savings over standard preventive programs. While initial implementation costs are higher, the long-term ROI is realized through maximized equipment life and optimized labor allocation.
- Energy Management became a vital function at the organization level to balance occupant comfort with peak mechanical performance. Effective programs rely on a dedicated energy manager (essential for facilities exceeding 300,000 square feet) to track daily and annual usage trends. By integrating demand-side management with strategic power procurement, managers can keep airports bustling with crowds by significantly reducing operating costs while maintaining the high-performance HVAC and lighting systems required for a productive terminal environment.
Nowadays, air quality in transportation hubs has shifted to a legal obligation. Managing IAQ at an airport required satisfying different authorities that often have overlapping yet distinct requirements. Hence, choosing air monitoring products that last and generate audit-ready data helps airports to automatically meet aviation frameworks.
The table below shows a review of several frameworks that foster a culture of safety and excellence by monitoring indoor air quality that transforms public trust.
|
Organizations |
Primary Focus |
Key Metrics |
|
ASHRAE 62.1 |
Ventilation & Design |
Minimum outdoor air rates and CO2 thresholds (e.g., maintaining < 1,000 ppm). |
|
WHO Air Quality Guidelines |
Long-term Health |
Stricter benchmarks for PM2.5 and NO₂ |
|
WELL Building Standard |
Promoting Well-Being |
Targeting VOCs, CO2 and enhanced filtrations to boost performance. |
|
OSHA |
Occupational Safety |
Setting exposure limits (PELs) for staff exposure to carbon monoxide (CO) and jet fumes. |

Case Study: How a Mid-Size Airport Improved IAQ During Peak Travel Season
As a medium-sized international airport in Southeast Asia faced recurring IAQ problems during peak travel months, Aeropulse steps in and assists in their solution to balance efficiency with occupants’ health.
While the facility was designed for high-volume throughput, the convergence of tropical humidity and dense aircraft operations was starting to affect the indoor environment. The management teams identify four major operational risks:
|
Particulate Infiltration |
Consistent PM2.5 spikes near boarding gates, seemingly synchronized with aircraft ground movements. |
|
Metabolic CO₂ Accumulation |
Critical carbon dioxide concentrations in bottleneck areas such as immigration and security checkpoints. |
|
Chemical Off-gassing |
Volatile Organic Compound (VOC) buildup within newly commissioned retail and duty-free zones. |
|
Human Capital Impact |
Increasing reports of building sickness symptoms, shown as fatigue and headaches, among tourists, ground staff, and security personnel. |
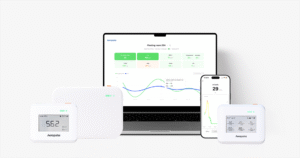
In order to solve the problem, the airport deployed our utilized Aeronode A100 and A200-CO₂ sensors across 42 strategic locations and, presumably, high-risk zones, including boarding gates, immigration and security areas, lounges, duty-free shops, and also baggage claim areas to monitor occupancy-driven and jet exhaust-borne pollution.
Continuous data was collected in real-time on the Aeropulse Dashboard, which provides a granular view of the terminal’s air quality. By data logging, some specific environmental concerns were uncovered along the way:
- The sensors identified a rhythmic spike in PM2.5 every 12–20 minutes. This was directly correlated with aircraft pushback operations, where jet blast and ground tug emissions were being pulled into the terminal’s air intakes.
- During peak arrival windows, CO₂ levels in immigration halls frequently exceeded 1,400 ppm, which is significantly above the ASHRAE-recommended limit and explains the fatigue reported by staff.
- Interestingly, the highest VOC concentrations occurred at night. The data revealed that floor polishing and heavy-duty cleaning agents used during the shifts were lingering in the air due to reduced nighttime ventilation.
- The dashboard flagged two specific ventilation units that were failing to maintain pressure, allowing outdoor exhaust to leak into the terminal skin.
After targeting the major problems, the airport decided to implement surgical improvements to move from reactive complaints to proactive outcomes.
- Demand-Controlled Ventilation (DCV): The invisible data trends led to the identification of underperforming HVAC units, allowing the maintenance team to fix specific mechanical faults, saving energy that would have been wasted on inefficient cooling. Automated cycles were programmed into the HVAC system, triggered instantly when pollutants crossed pre-set safety thresholds.
- Strategic Pressurization: Based on the data given by A100 and A200-CO2, the facility team adjusted the pressure balance at gates facing the runway, physically preventing outdoor exhaust from entering the building. To optimize this defense, the airport revised its air handling unit. (AHU) return fan operations to better synchronize with real-time building pressure sensors.
- Cleaning Schedules: Shifting high-intensity sanitation to low-occupancy hours to allow for a purge cycle of fresh air before the first morning flight crews arrived, ensuring VOC levels were neutralized.